Ideas for Math teachers
IDEA # 1: Students can be given math problems using AIDS-related statistics to solve. Below are some examples:
1. Of 120 people who have HIV, 24 of them do not know they are infected. What is the ratio of people who do not know they are infected with HIV?
Answer: 1:5 do not know
2. In 2009, if there are 4008 people infected with HIV in a month in the U.S., how many people would be infected in a year?
Answer: 48,096
3. In 2010 of 47,130 people diagnosed with HIV 9,868 in the U.S. were female. To the nearest percent, what is the percentage of the females diagnosed in 2010?
Answer: 21%
4. In 2010, in 46 of the states in the U.S. 6/13 people who were diagnosed with HIV were African American. Of 96 people who are positive for HIV how many are African American?
Answer: 44
The Sexual Exposure mathematical formula is: 2n + 1 = X
2: Represents you (1) and your partner (+1 = 2)
n: Represents you and your current partner’s number of exposure (this is a compounding number – assuming that each person you have had sex with has the exact same number of partners as you)
1: Represents your current partner (this remains the same)
X: The number of your current exposure
The viral load test measures the amount of HIV virus in your blood:
For prognosis, viral load can help predict how long someone will stay healthy. The higher the viral load, the faster HIV disease progresses.
For prevention, viral load predicts how easy it is to transmit HIV to someone else. The higher the viral load, the higher the risk of transmitting HIV.
For managing therapy, the test shows treatment is controlling the virus. Current guidelines suggest measuring baseline (pre-treatment) viral load. Treatment is “working” if it lowers viral load by at least 90% within 8 weeks. The viral load should continue to drop to less than 50 copies within 6 months. The viral load should be measured within 2 to 8 weeks after treatment is started or changed. It should be monitored every 6 months after that for patients with good adherence who have an undetectable viral load and have been clinically stable on their treatment for 2 or 3 years. According to the guidelines, treatment failure is indicated by a confirmed viral load above 200 copies.
Viral load changes are often described as “log”changes. This refers to scientific notation, which uses powers of 10. For example, a 2-log drop is a drop of 102 or 100 times. A drop from 60,000 to 600 would be a 2-log drop.
CD4 test questions: CD4 cell or T-cell is a white blood cell that is part of the immune system. HIV most often infects CD4 cells. The virus becomes part of the cells, and when they multiply to fight an infection, they make more copies of HIV.
The diagnosis of AIDS is made by calculating the percentage of CD4 cells in ml of blood. The normal range is somewhere between 30% and 60%. Different labs use different ranges. There are no guidelines for treatment decisions based on CD4%. However, a CD4% below 14% is a definition of AIDS.
Example if a person has
600 T-cells, 800 neutrophils, 200 macrophages, and 200 NK cells what is the percentage of T-cells and does this person have
AIDS.
Answer: 33% not they have progressed to AIDS
IDEA # 2: The class can also look up local, state and national HIV/AIDS statistics to turn into simple graphs.
For San Diego statistics, visit the San Diego County Epidimiology Unit at http://www.sdcounty.ca.gov/hhsa/programs/phs/hiv_aids_epidemiology_unit/reports_and_statistics.html.
For United States statistics, visit the Centers for Disease Control and Prevention at https://www.cdc.gov/hiv/basics/statistics.html
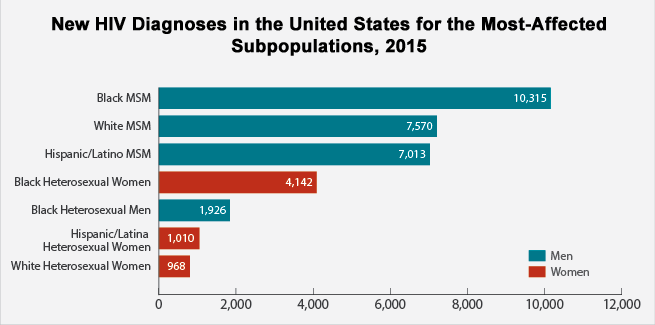
IDEA # 3: Graphs can be used to do graphing point math exercises. See example below.
These tips are brought to you in collaboration with National University students and Operation Samahan’s Youth 2 Youth Center; Facebook at https://www.facebook.com/y2ycenter/ or Twitter at Y2Y_Center
